Machine learning predictive model prototyping
Optimizing business processes through prediction is extremely powerful and can lead to dramatic gains in efficiency. The best way to build strong models is through rapid prototyping and iterative trial-and-error.
You can build predictive models by following a consistent framework. First, reshape the data so it is easy to analyze and split it into training and evaluation sets. Next, choose a learner suited to the objective, train and tune it, and validate its performance with cross-validation. Finally, run inference on test data to evaluate how well the model generalizes to unseen data. By mastering and executing this flow quickly, you can produce reproducible, high-quality models for any prediction task.
With Allye you can complete this prototype in just five minutes—experience the incredible productivity for yourself!
Here we will use the classic iris dataset to build a classification model.

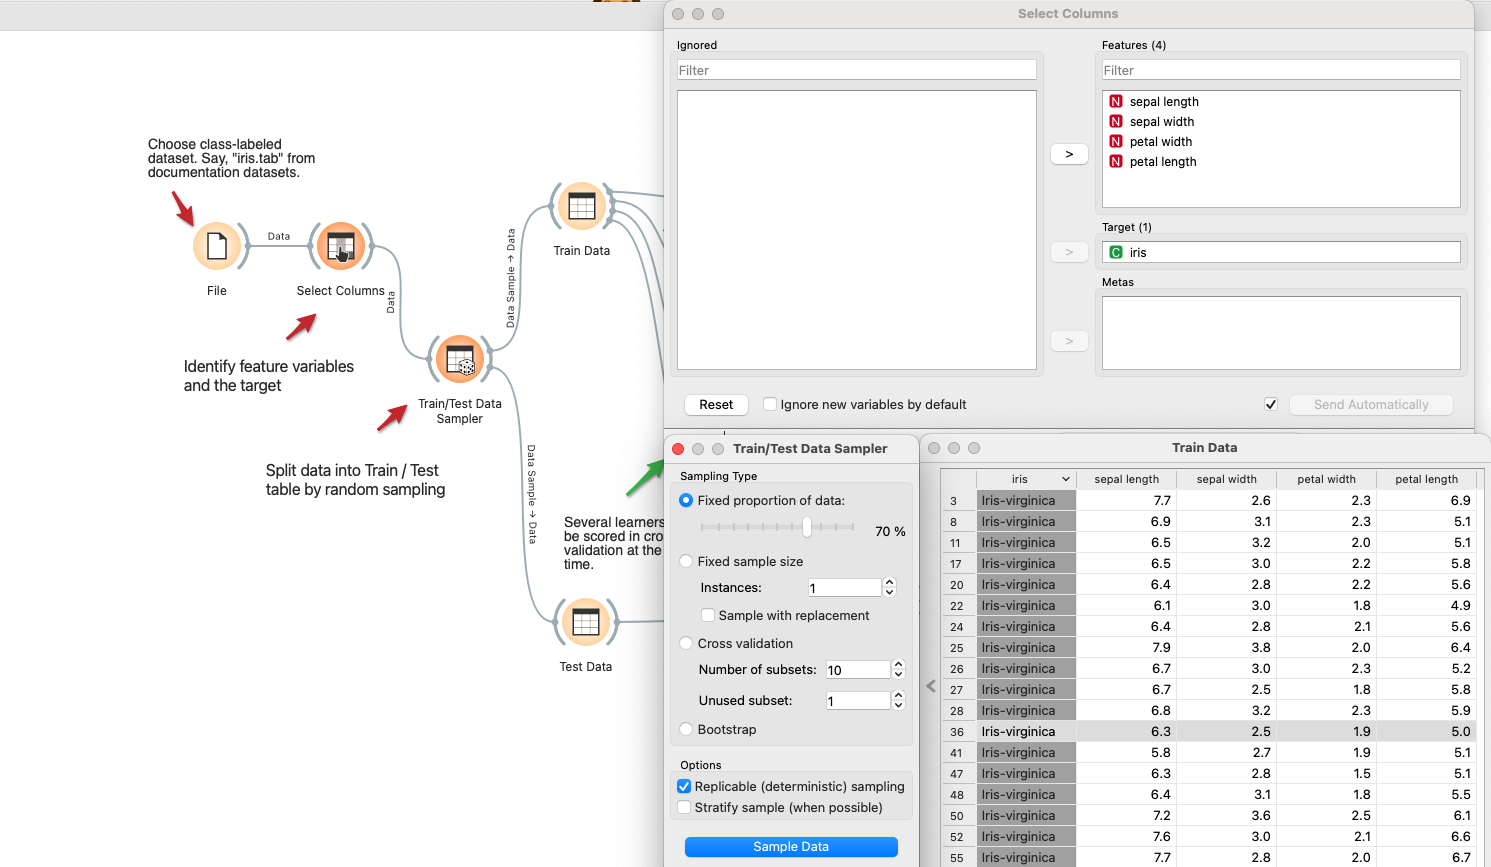
- Define variables and split the data
- Use the
Select Columnswidget to choose the features and target. - Connect to
Data Samplerto randomly split the data into two parts. Here we use 70% as the train data and the remaining as the test data.
- Use the
- Select learners and set parameters
- In the
Modelsection, pick a few classification learners and connect them toTrain Data Table. Here we useLogistic Regression,Random Forest, andSVM. - Open each learner widget to configure the parameters for its algorithm.
- In the

- Configure cross-validation and view the confusion matrix
- Connect each learner to the
Test and Scorewidget in theEvaluationsection. - Then connect it to the
Confusion Matrix. - With the settings below, 10-fold cross-validation runs for every learner and computes key metrics such as AUC, precision, and recall—in seconds.
- Connect each learner to the
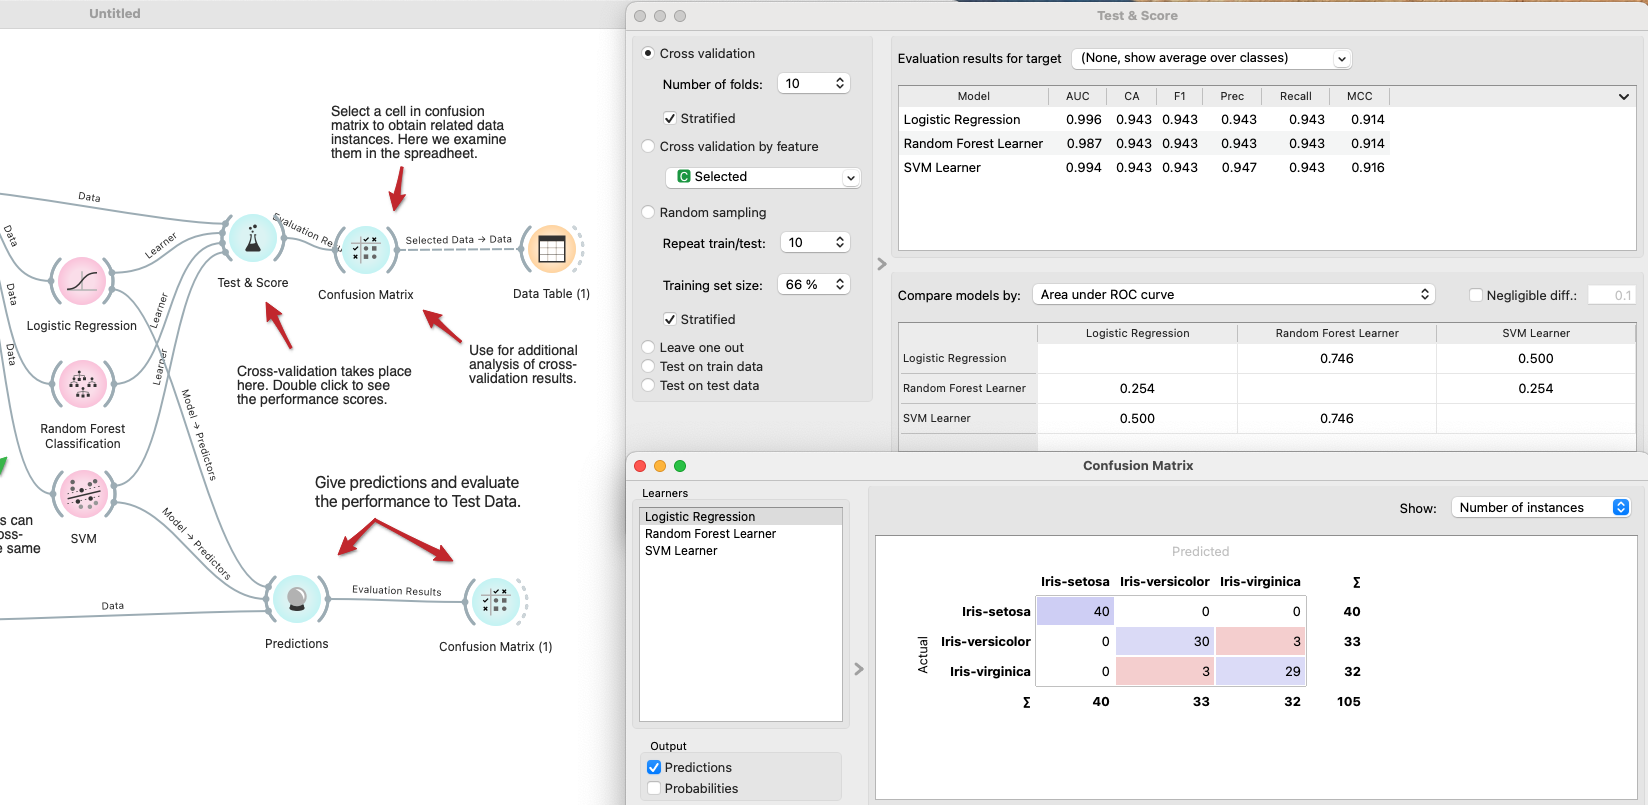
- Run inference and evaluate
- Add the
Predictionwidget from theEvaluatesection and connect both theTest Data Tableand the learners. - Cross-validation showed that Logistic Regression and SVM performed best, so run inference with those two algorithms.
- Create one more
Confusion Matrixwidget, connect it, and confirm the generalization performance.
- Add the