Connected Visualization
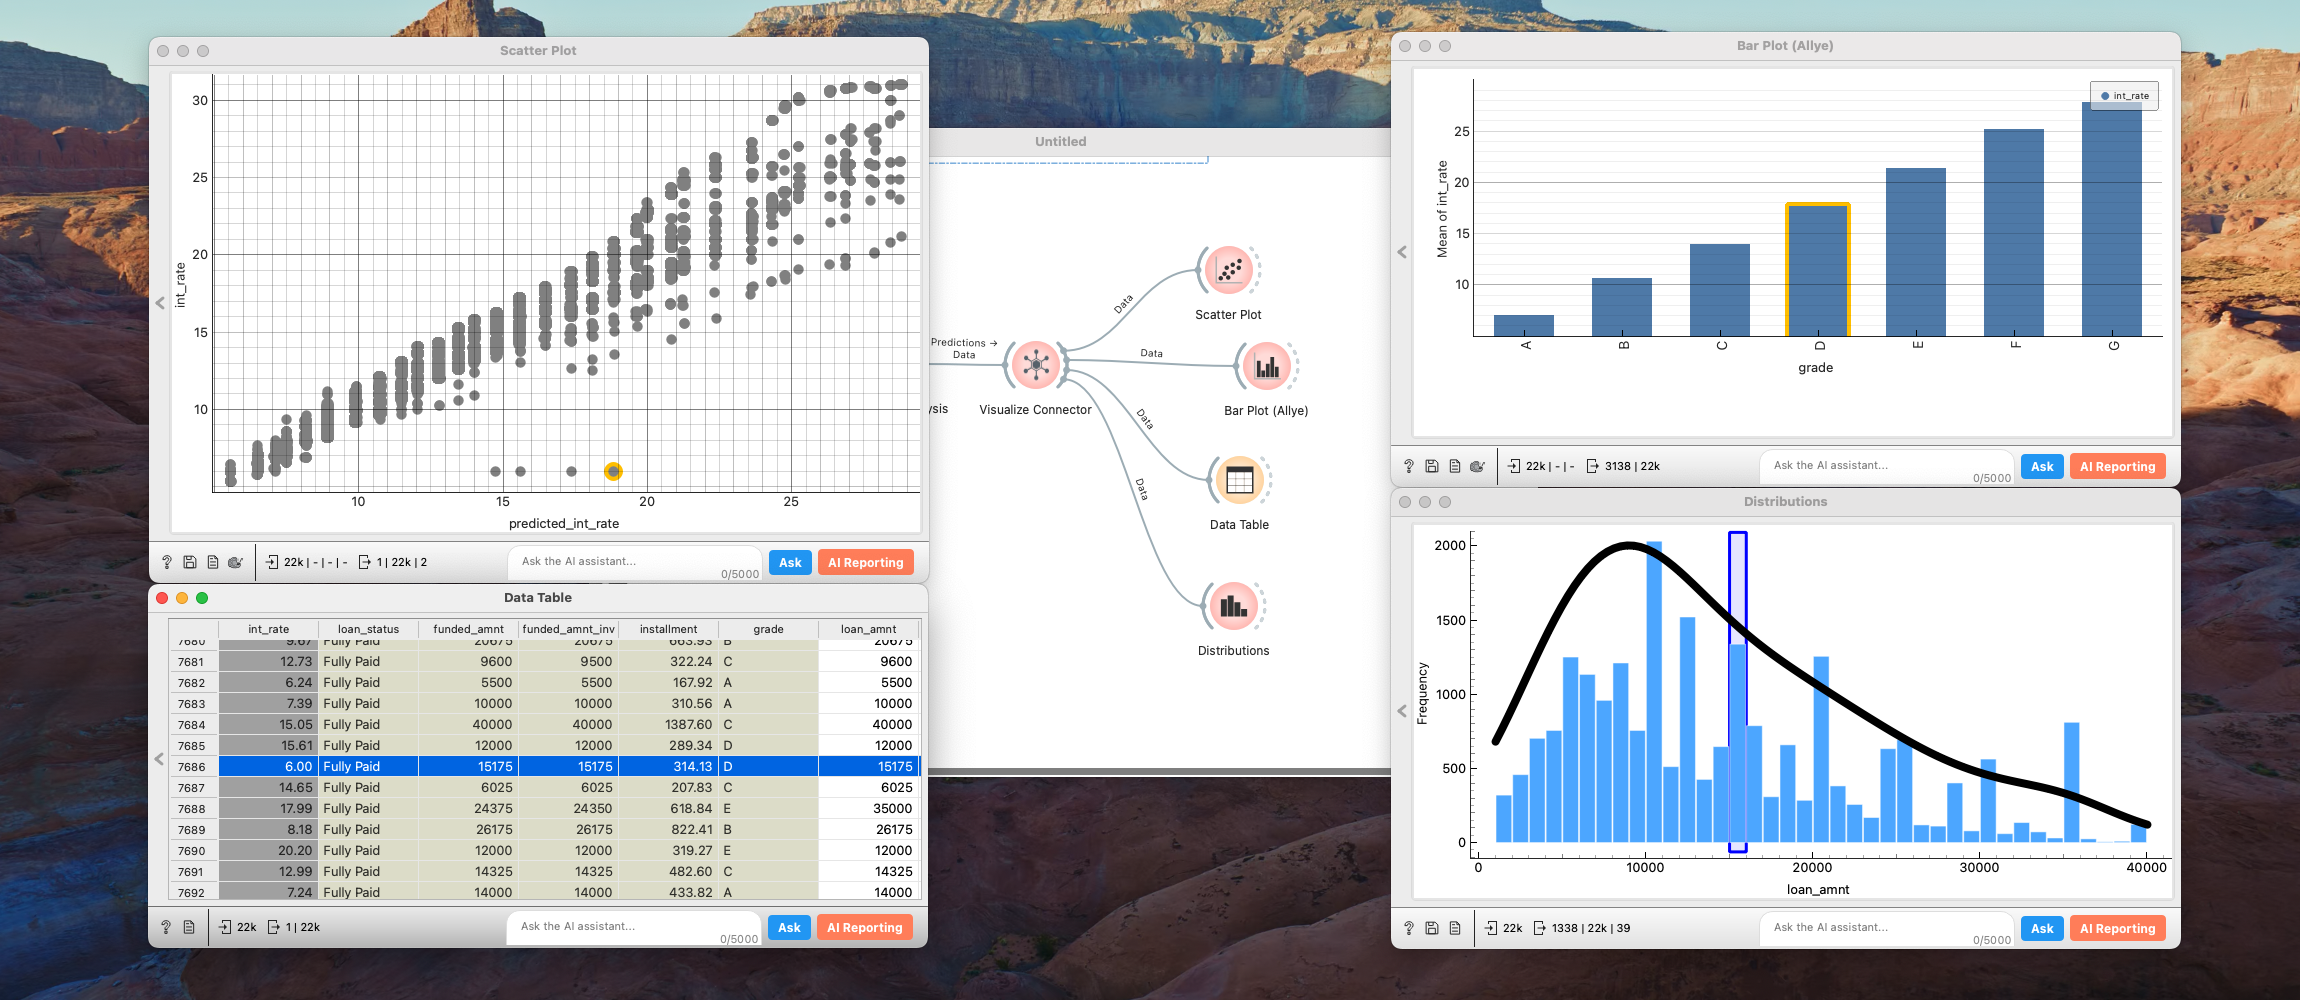
Connected visualization is an interactive way to explore data where multiple charts, tables, and widgets stay in sync with each other. Instead of analyzing each visualization in isolation, you select data points in one view and immediately see the same selection reflected everywhere else.
In the example above, a scatter plot, bar chart, histogram, and data table are all connected:
- When you select outliers in the scatter plot, those records are instantly highlighted in every other visualization widget.
- This synchronized selection makes high‑dimensional data easy to understand at a glance.
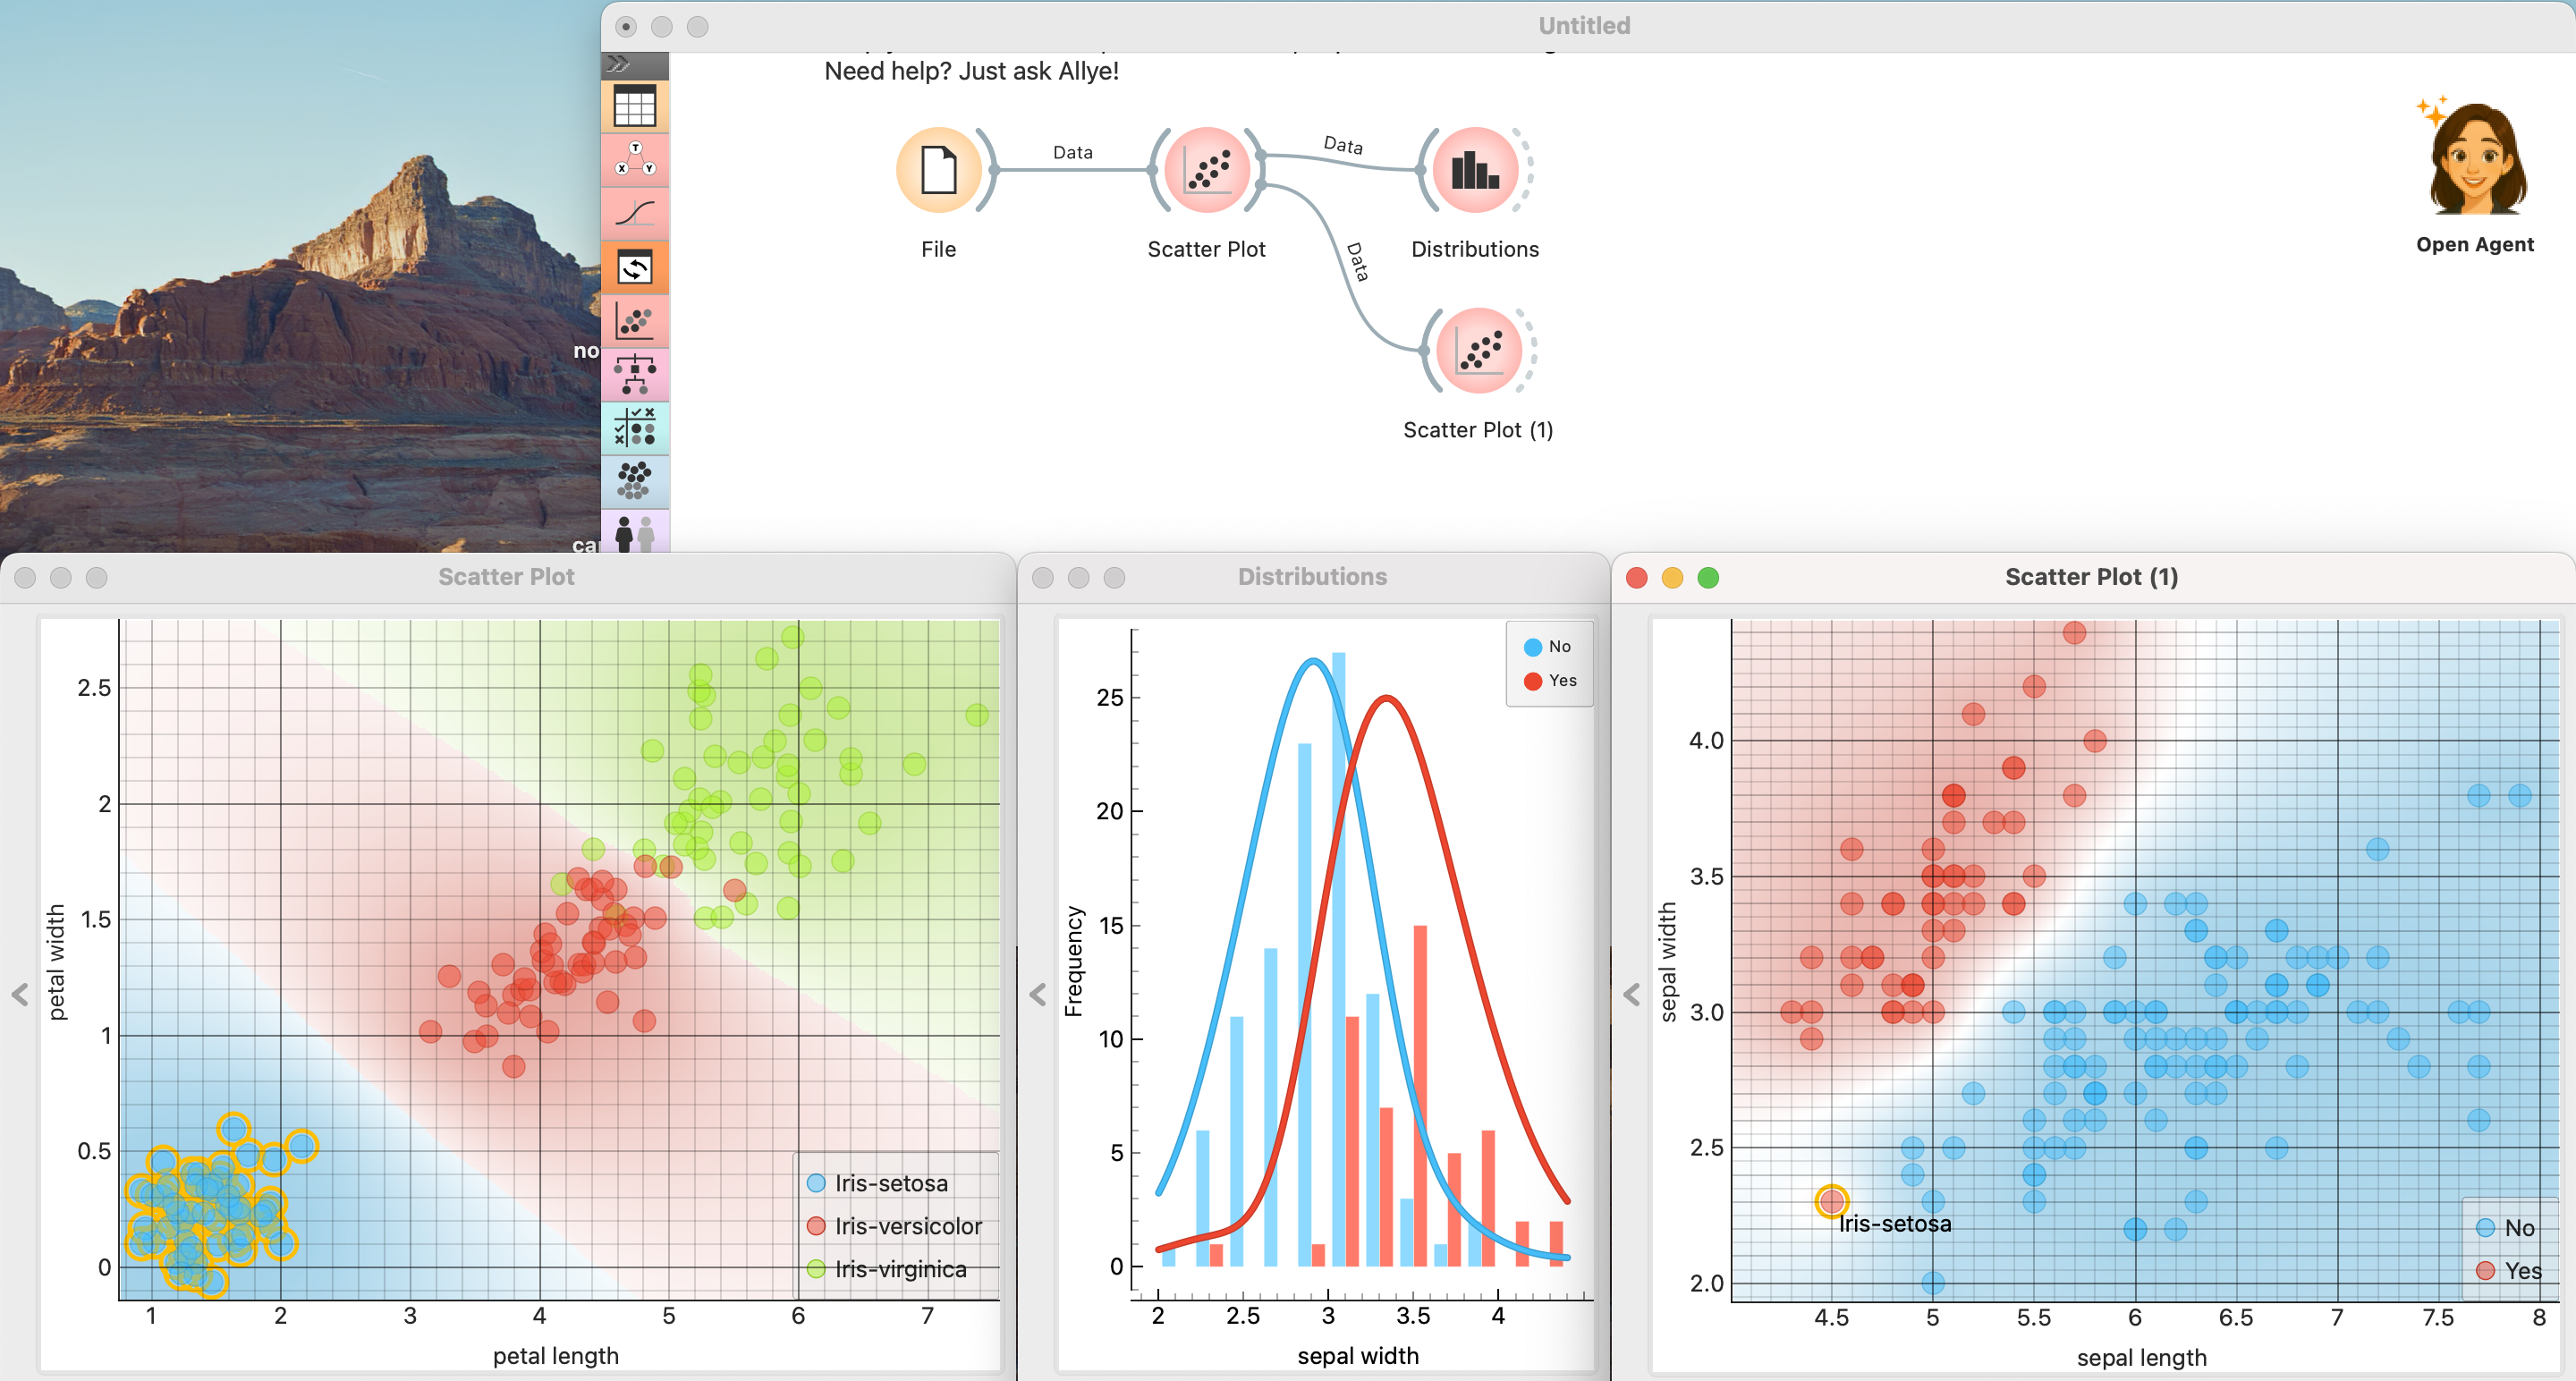
By linking selection across all visual widgets, connected visualization supports faster insight, more intuitive exploration, and better decision‑making when working with complex, high‑dimensional datasets.