Change Color & Font
Coloring works with most visualization widgets, such as scatter plot, distributions, box plot, bar plot and linear projection. Set the colors for discrete values and gradients for continuous values in Color widget in Visualization section, and the same palletes will be used in all downstream widgets.
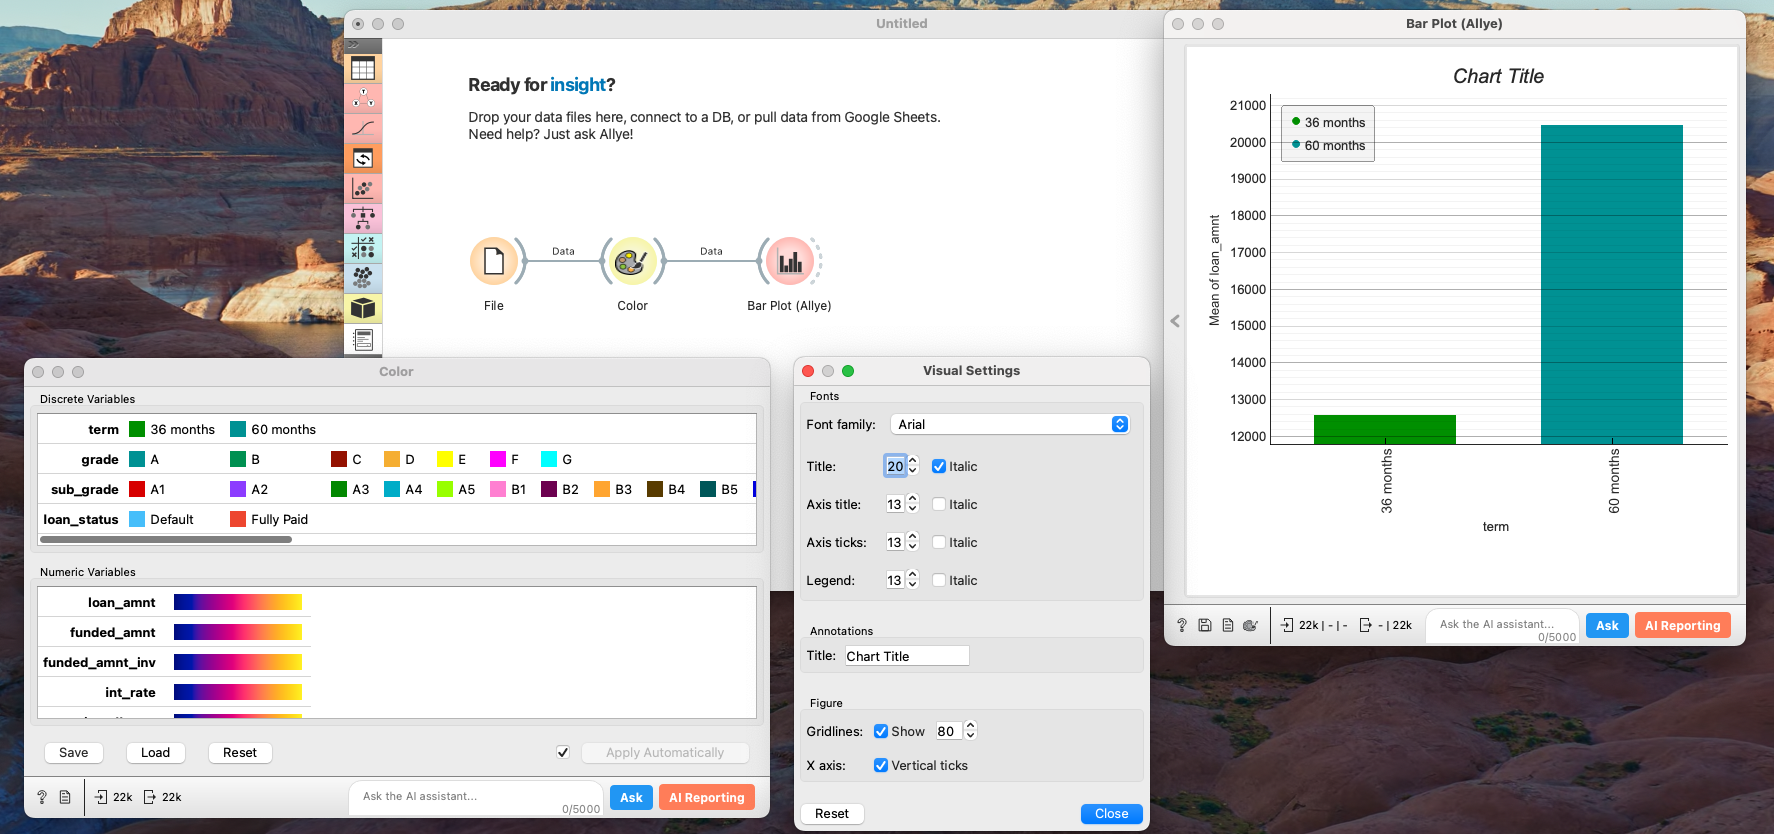
Change Fonts and Title
![]()
Click the color palette icon at the bottom left of the widget to change the font family, size, and title.
Change Scale
Hover over the Y or X axis and scroll to zoom in or out and adjust the scale for that axis.