Quickstart
This quickstart will walk you through a project using Allye's core features. By the end, you'll be familiar with simple visualization, data manipulation, modeling and Agent.
In this project we will use open data LendingClub Loan Data. You can download from this link.
1.Visualization
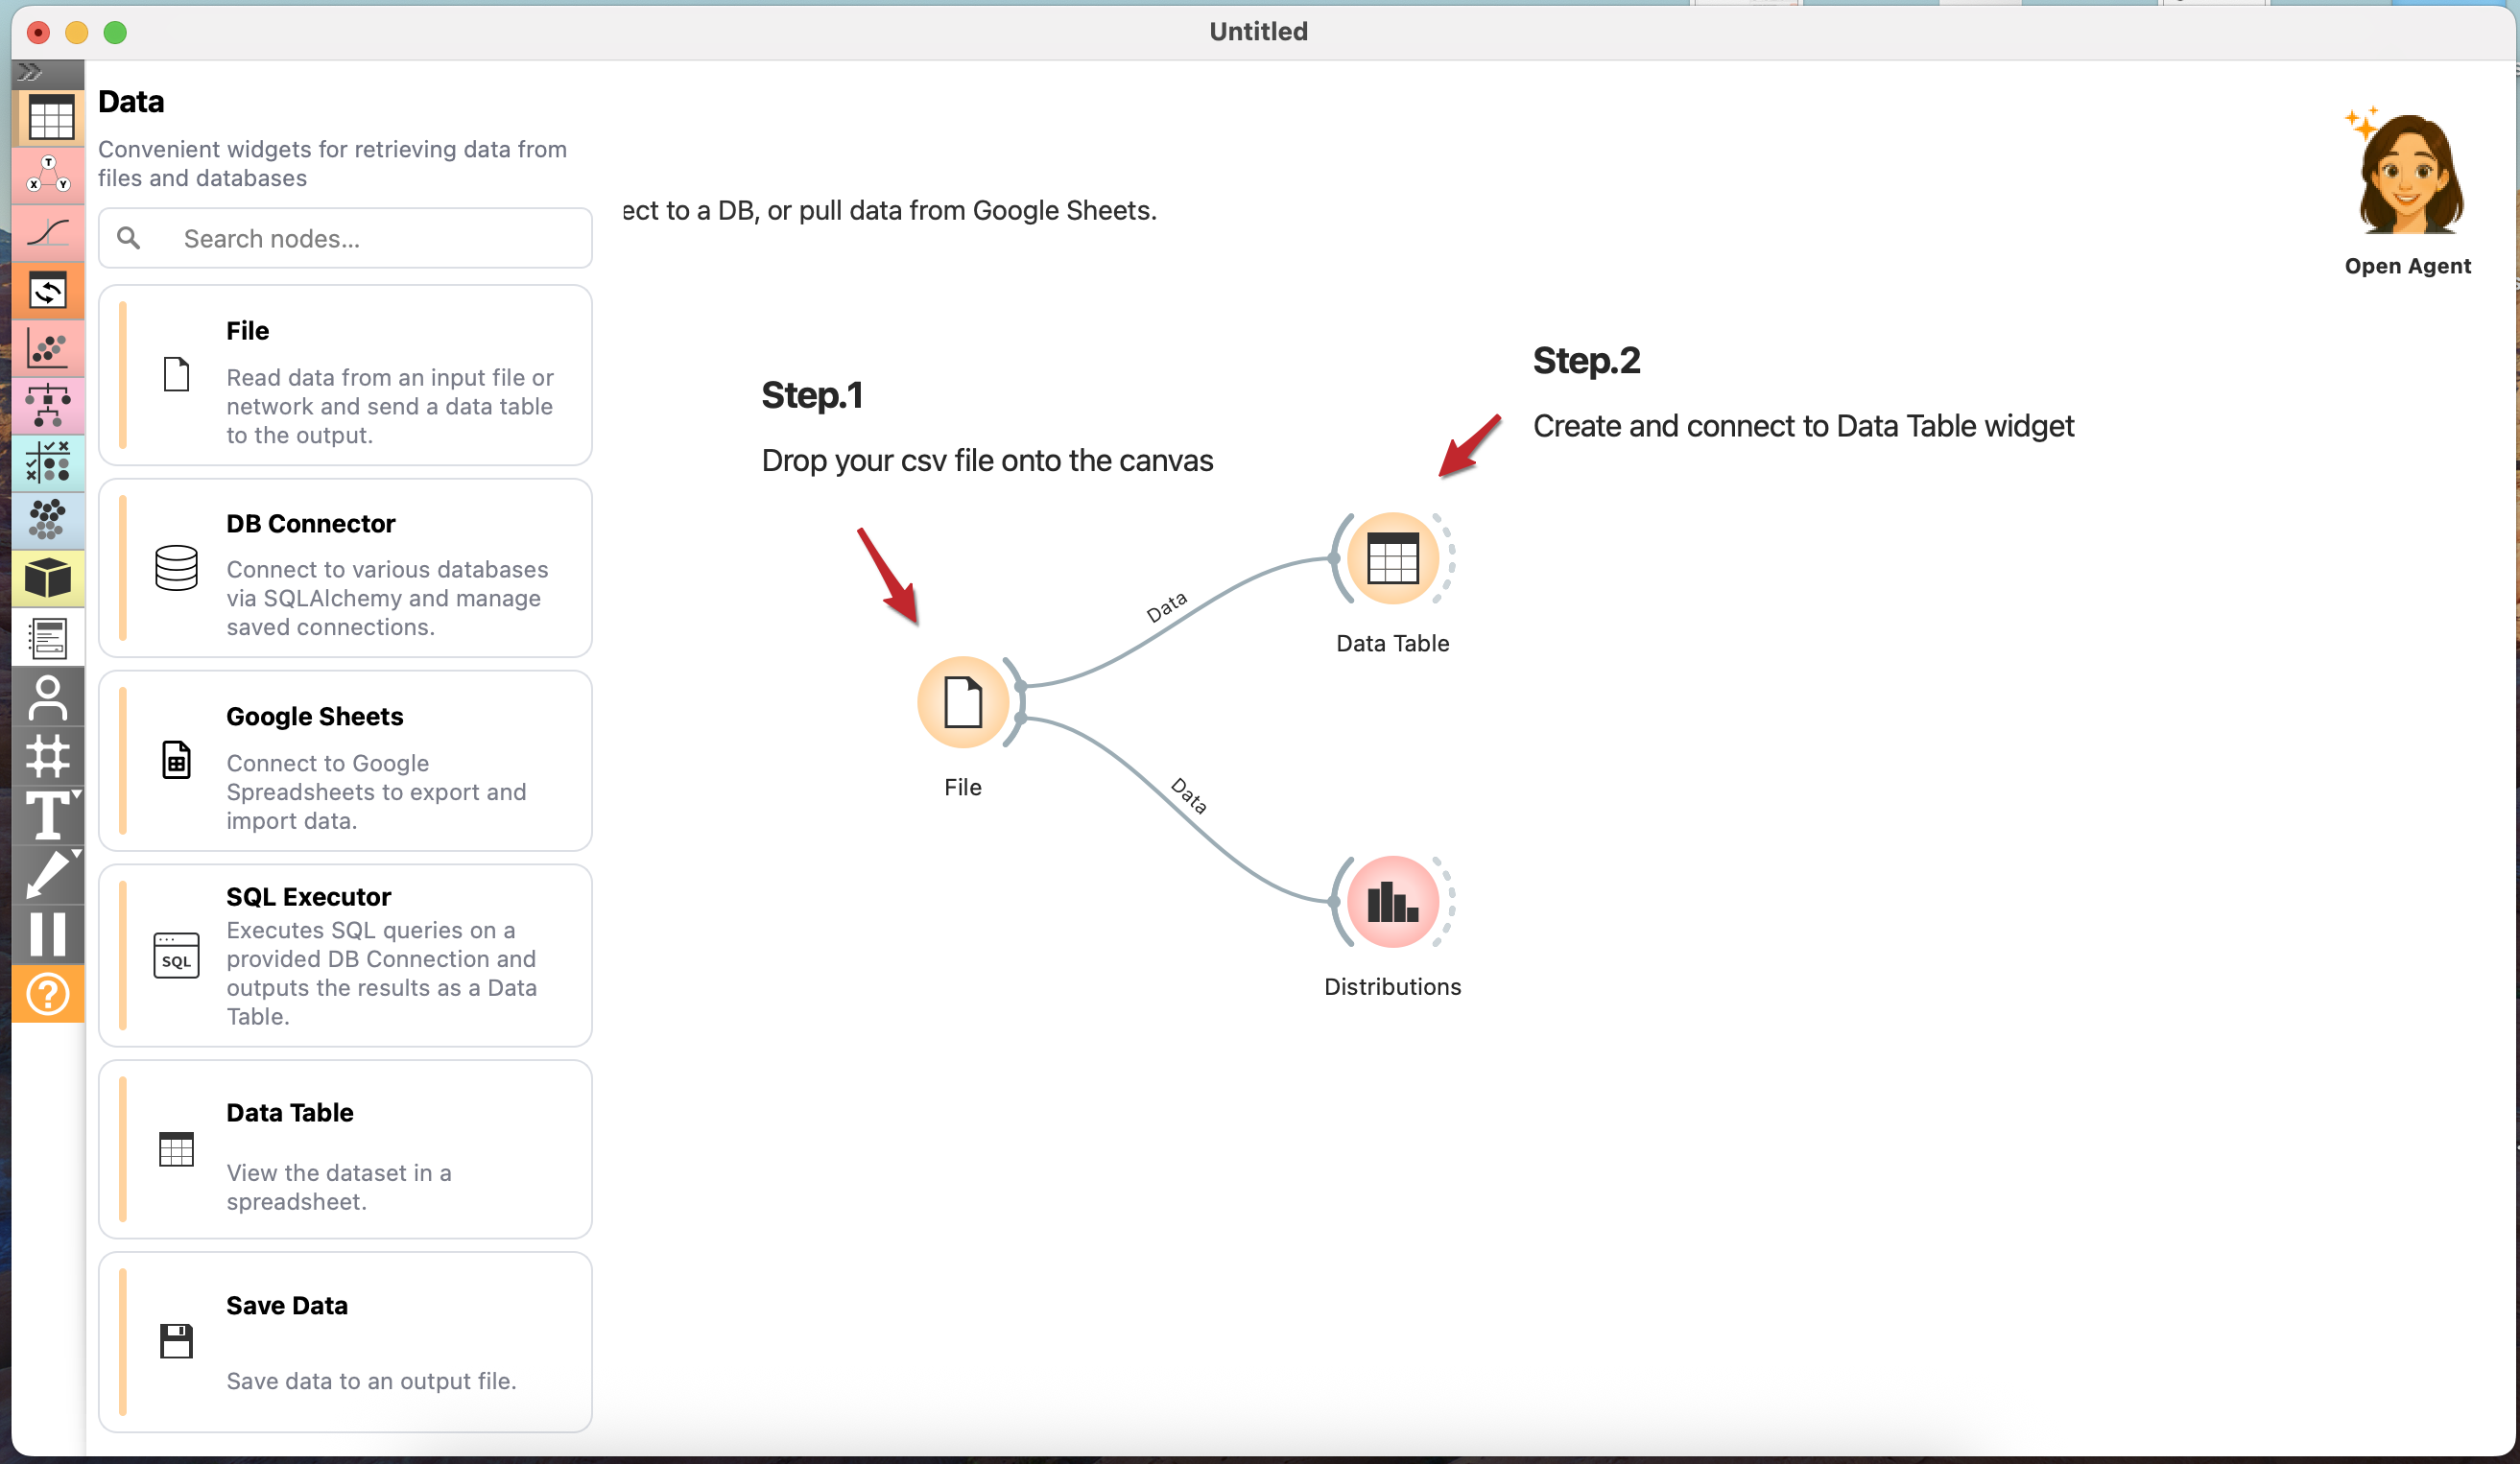
- Drag and drop csv file onto the canvas. You can download from this link
- From the left panel, create
Data Tablein theDatasection andDistributionin theVisualizesection. - Connect edges to those widgets from
Filewidget. - Open the widgets and you should see Raw data as well as histogram.
2.Data Manipulation
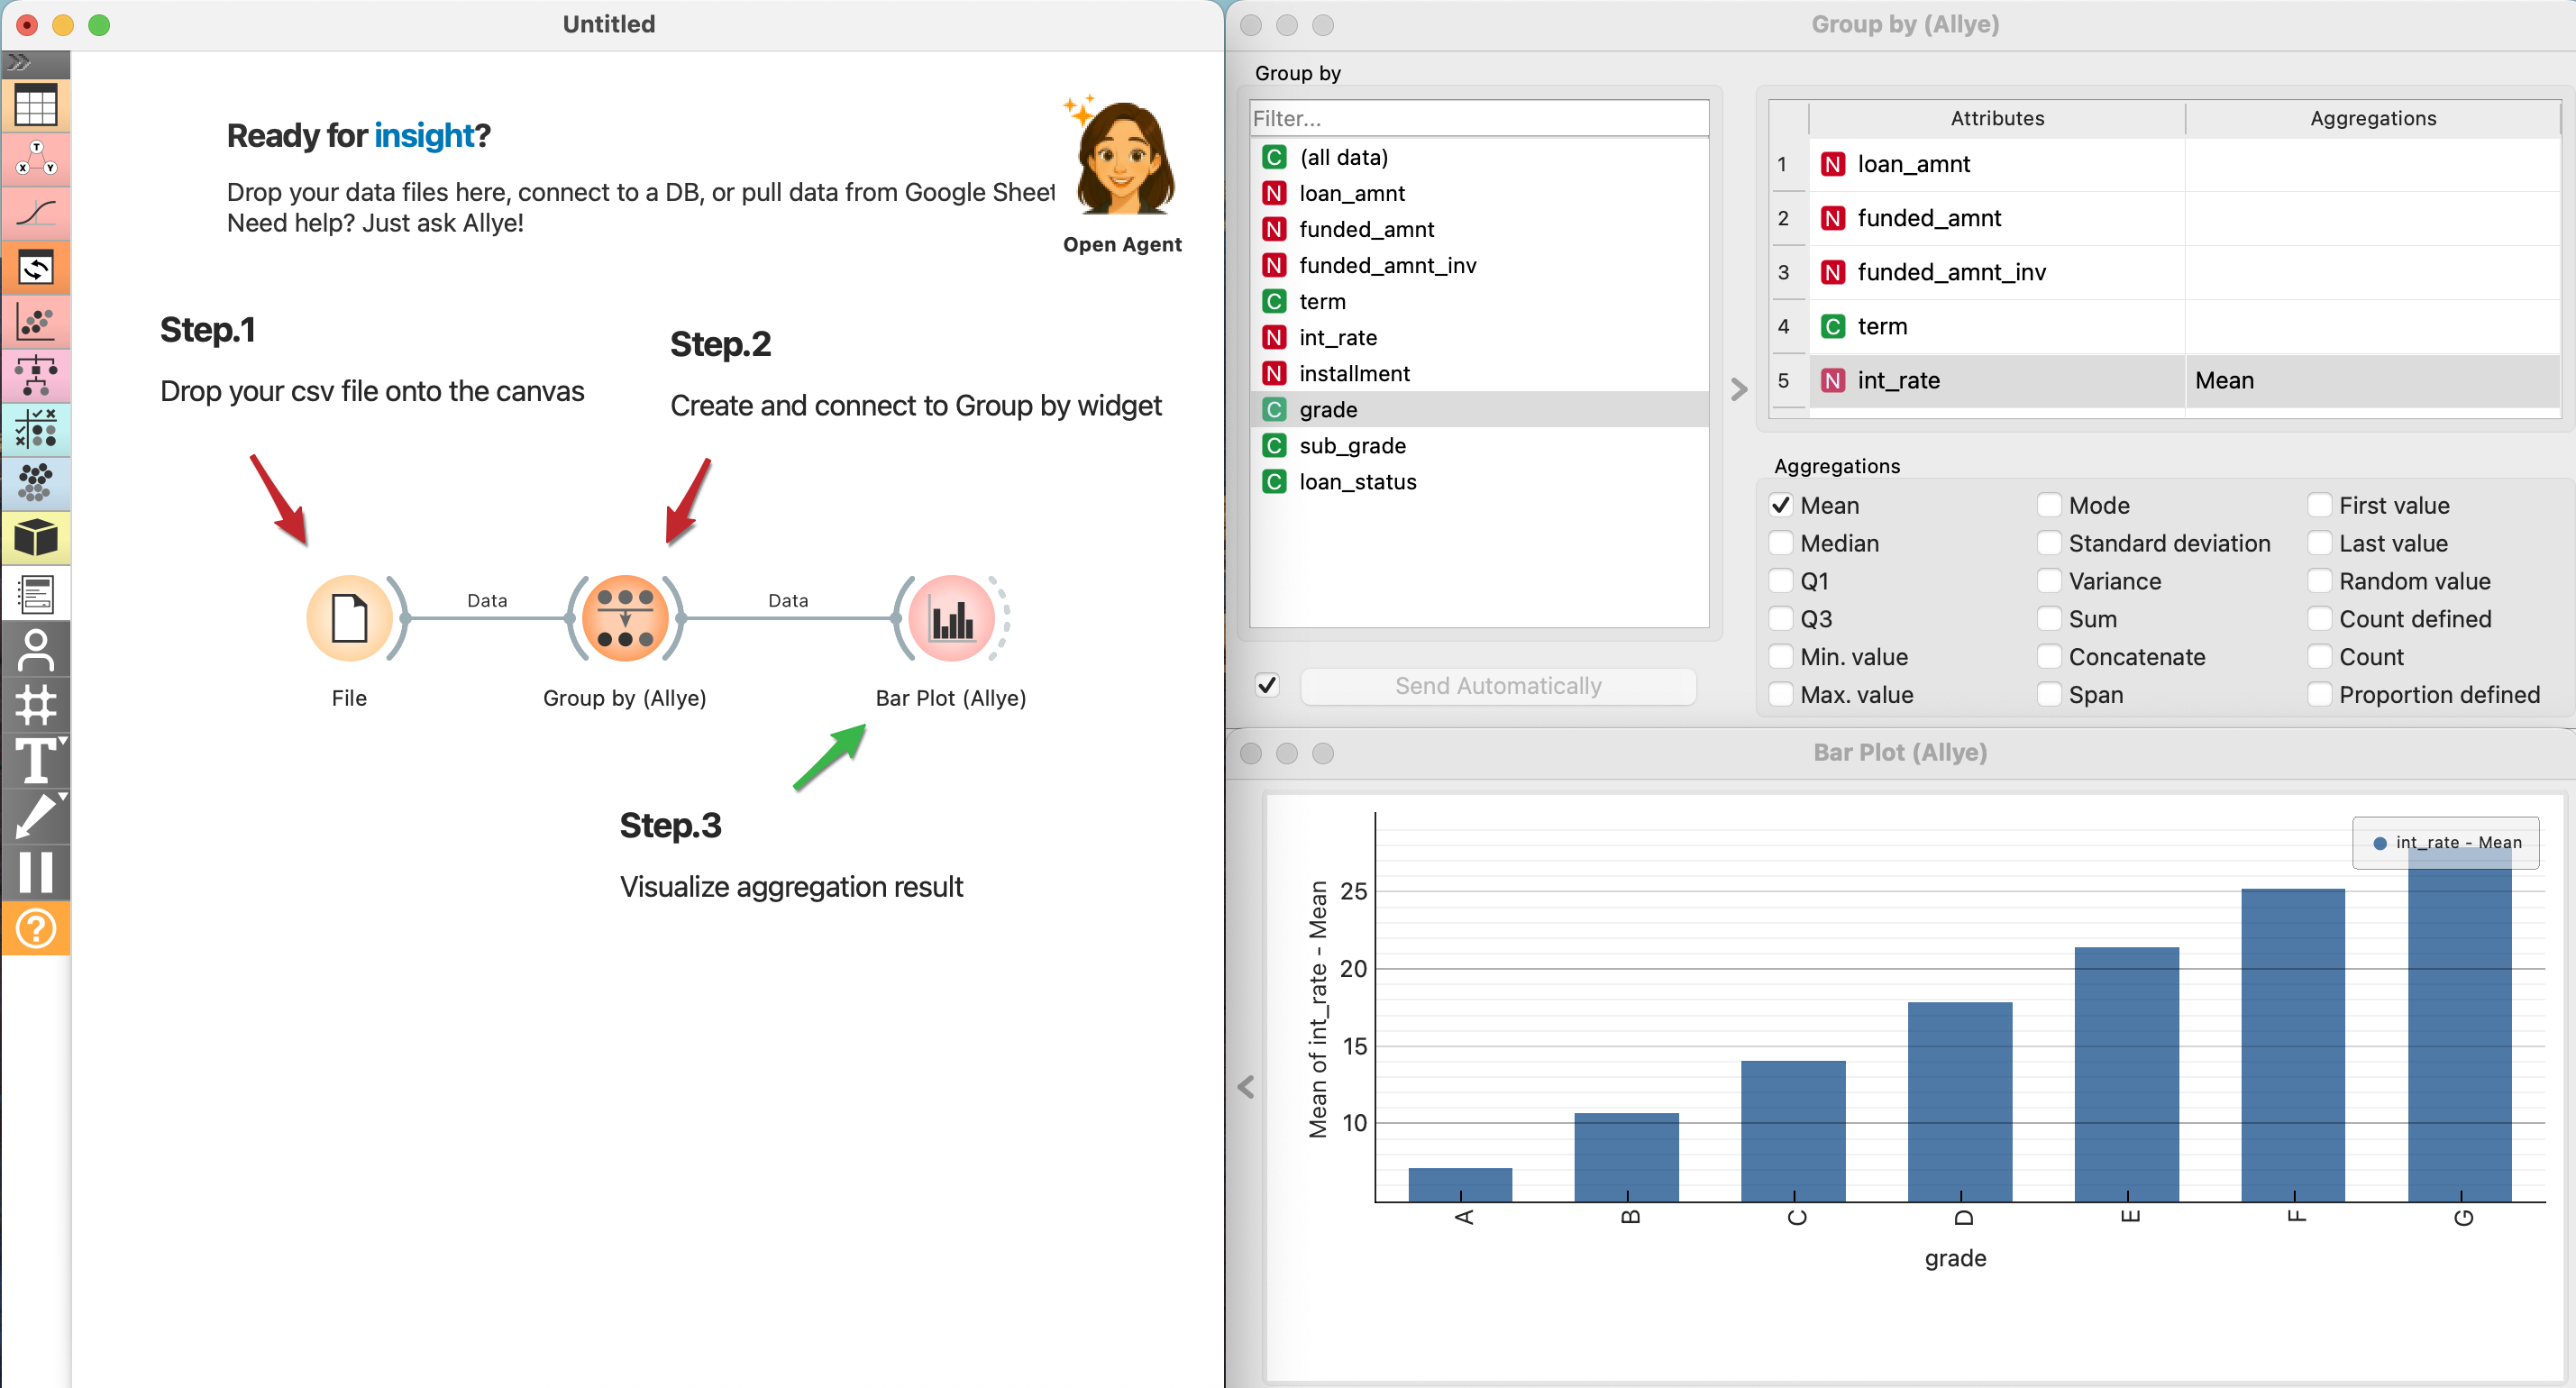
- From the left panel, create
Group by (Allye)in theTransformsection. - In Group by, select
grade; from Attributes, chooseint_rateandMean. - Create
Bar Plot (Allye)from theVisualizesection and connect it to theGroup by (Allye)widget. - Select
gradefor the X-axis andint_rate - Meanfor the Y-axis to see the average interest rate by grade.
3.Advanced Statistics
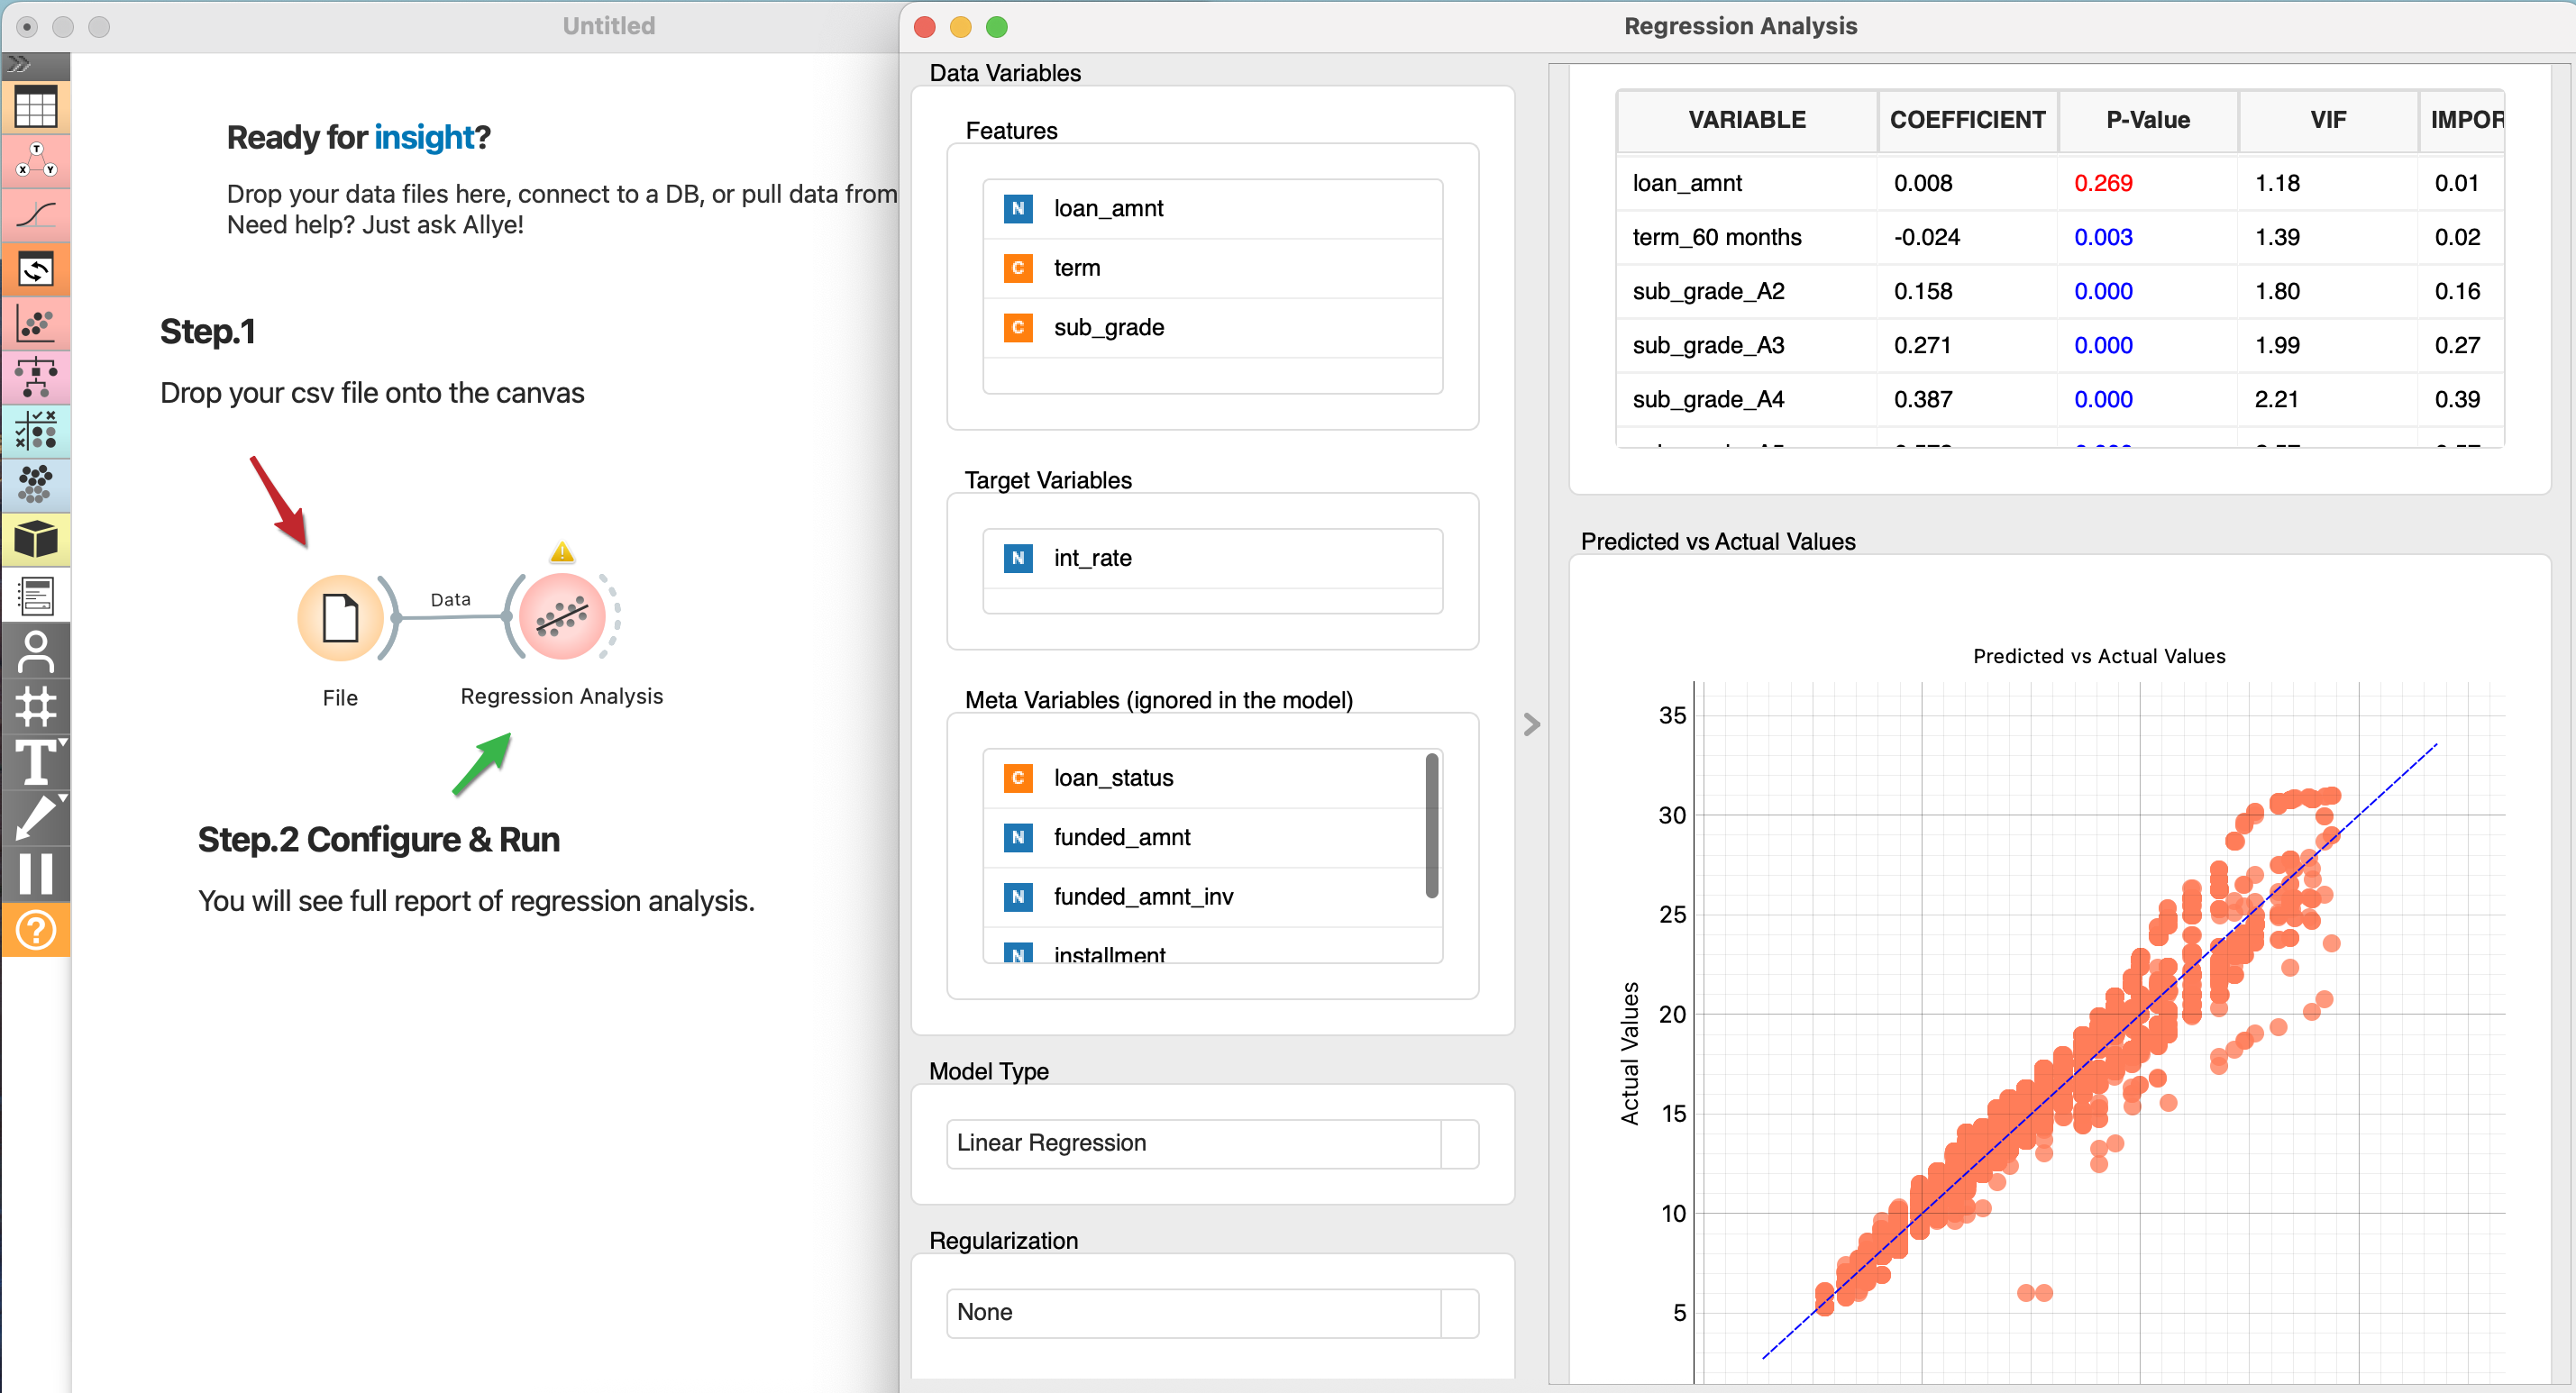
- From the left panel, create
Regression Analysisin theStatistical Analysissection and connect it to the File widget. - Choose
loan_amnt,term, andsub_gradeas Features; selectint_rateas Target Variables; set Regularization to None, and choose the remaining options as shown in the image below. - Click the Apply button and review the Full Report that appears in the Main Area.